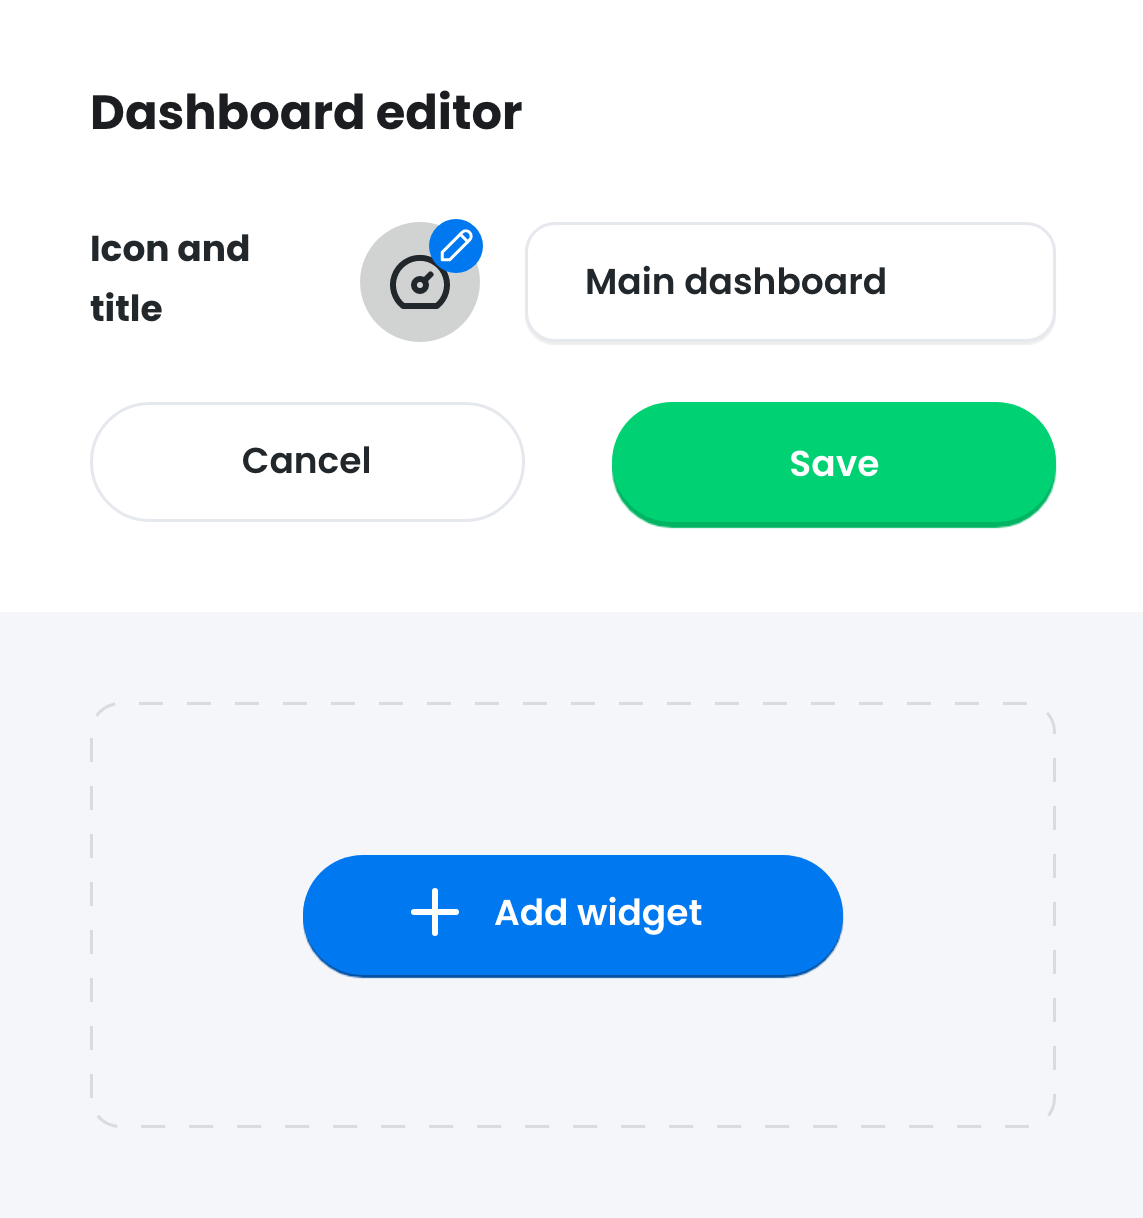
Visual editor
The visual dashboard editor makes it easy and clear to design your dashboard. You can choose from 25 different widget types. The canvas has a width of three columns and an unlimited number of possible rows. This gives you the freedom to build a suitable dashboard for virtually any situation.
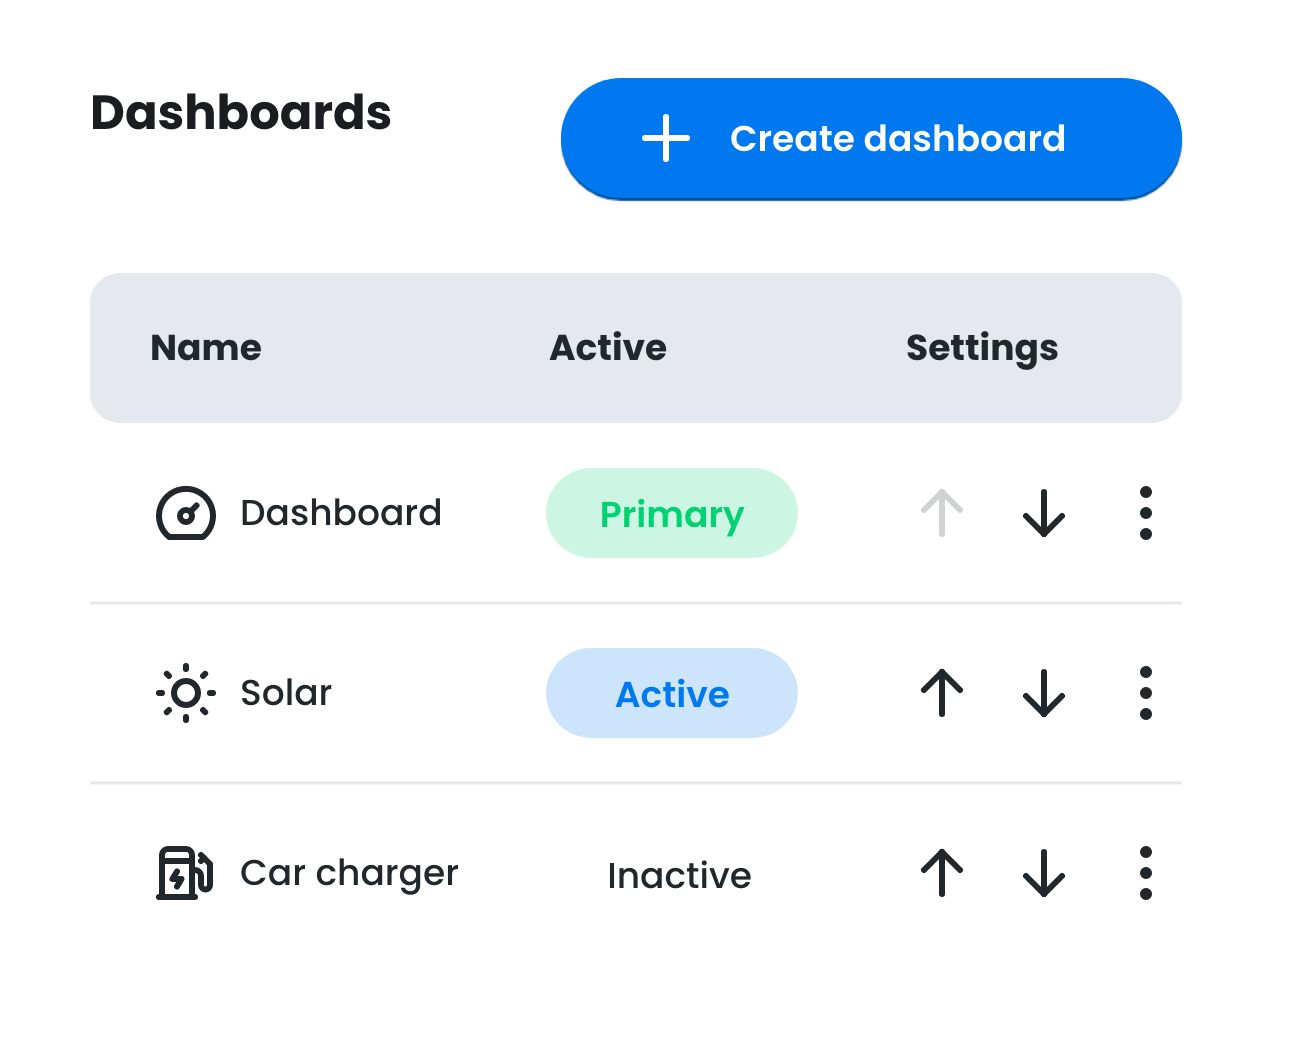
All about Dashboards
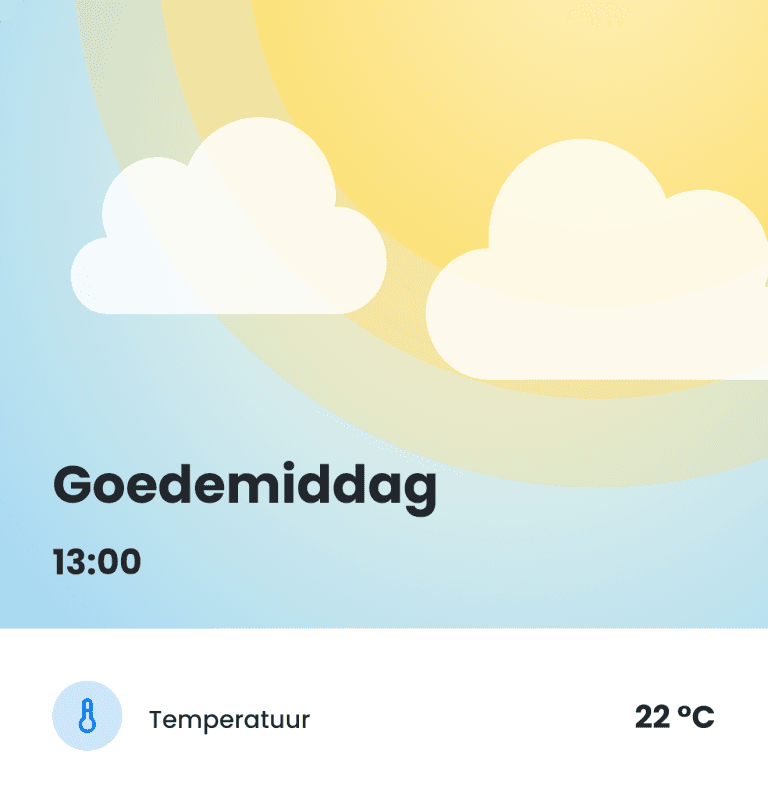
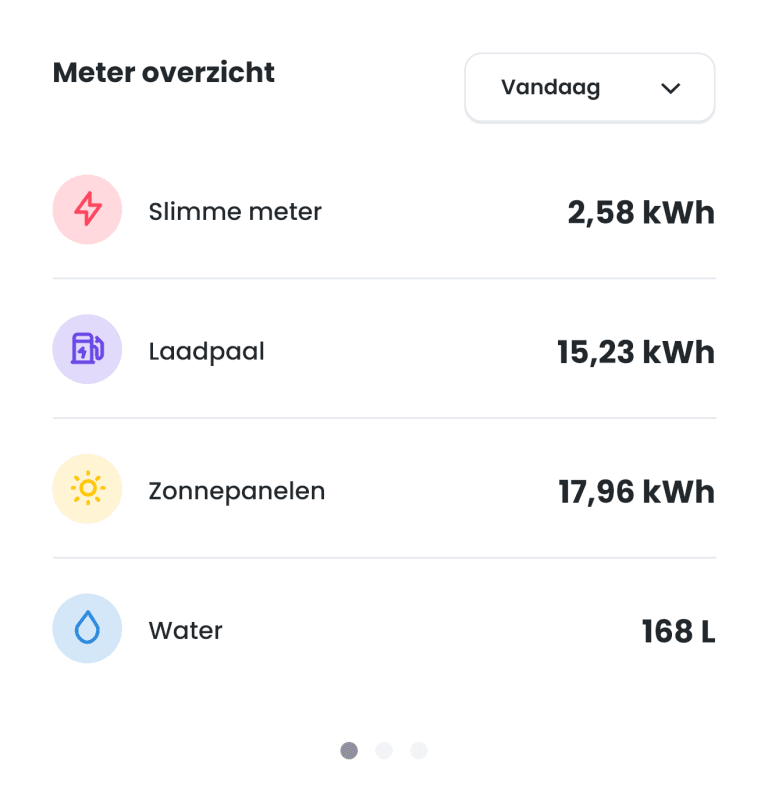
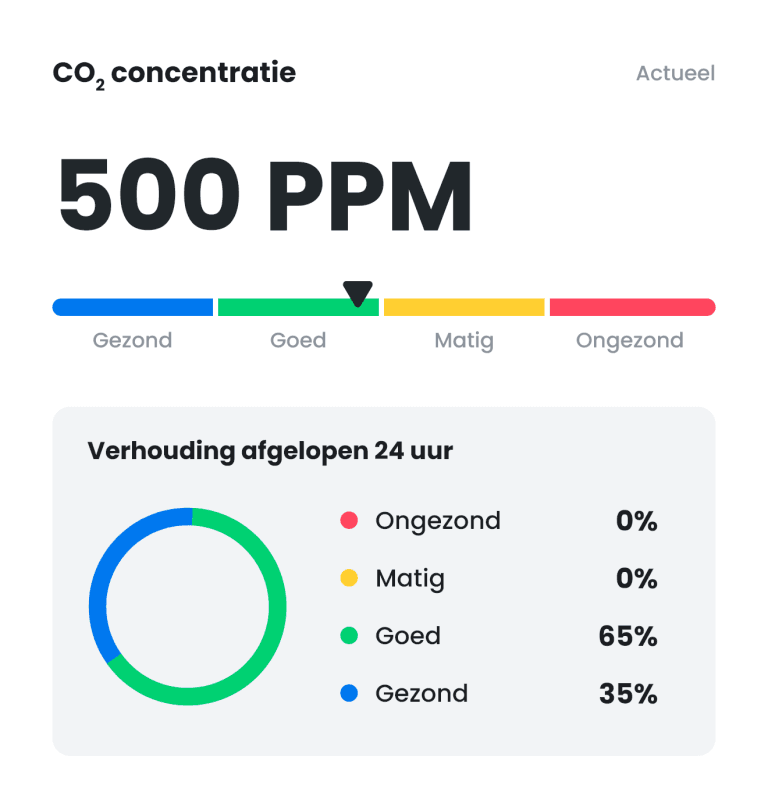
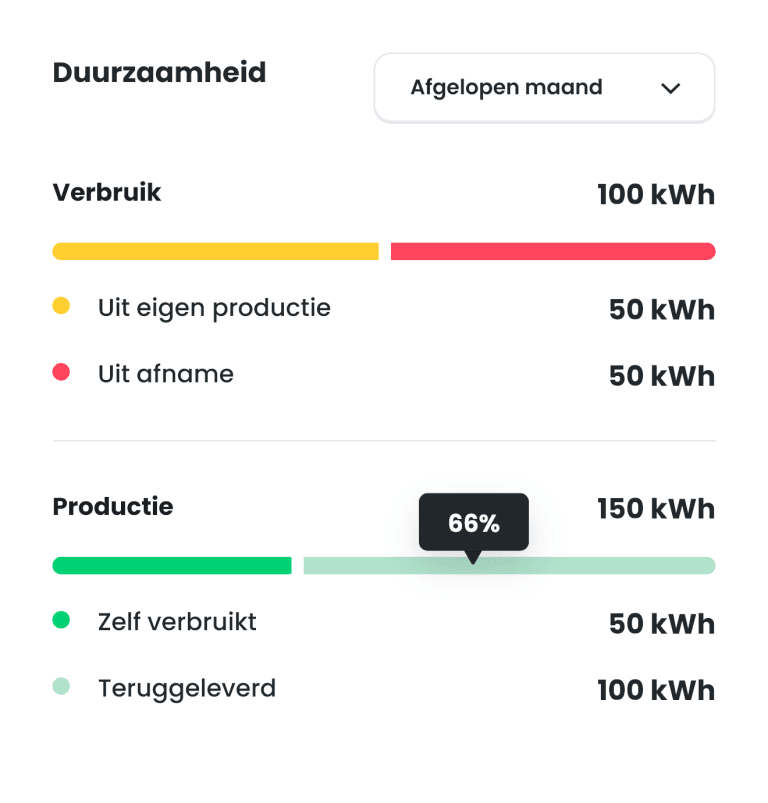
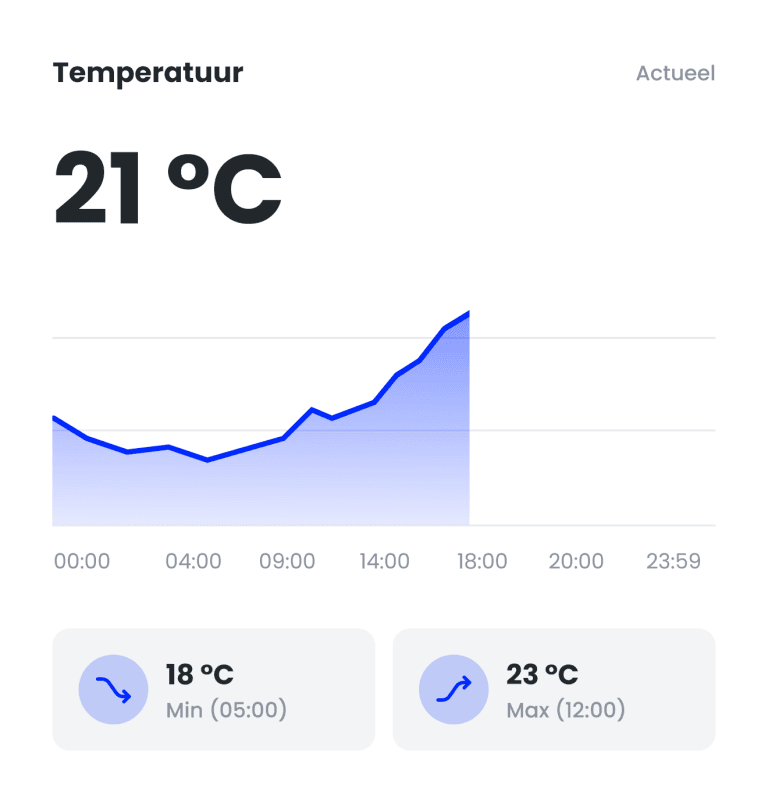
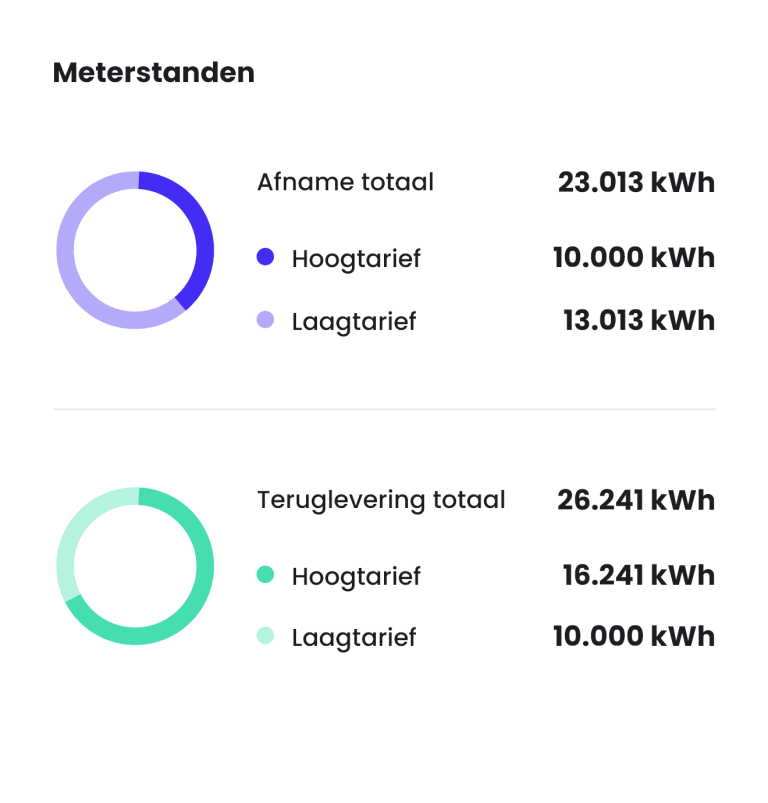
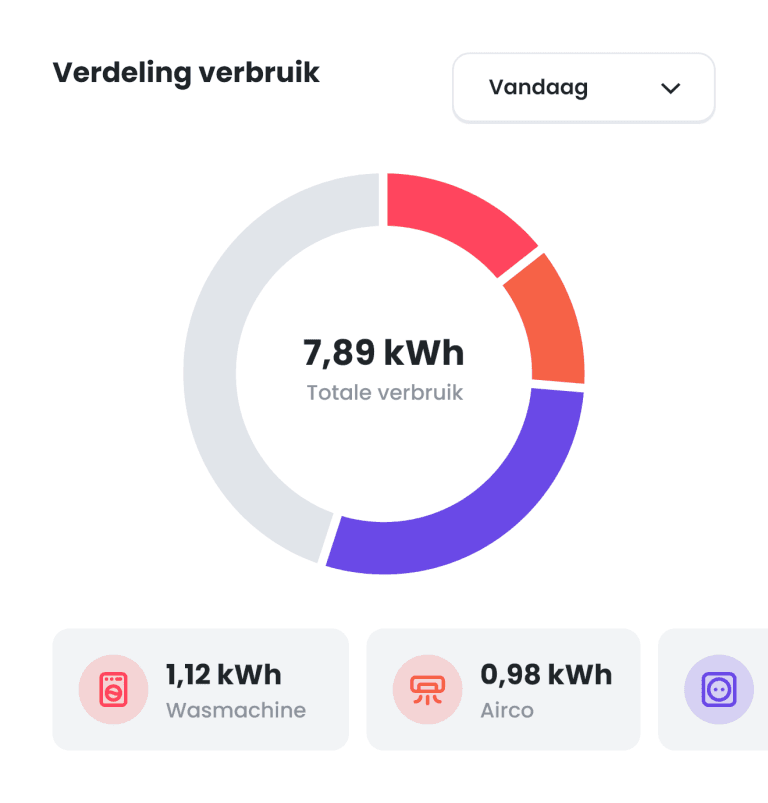
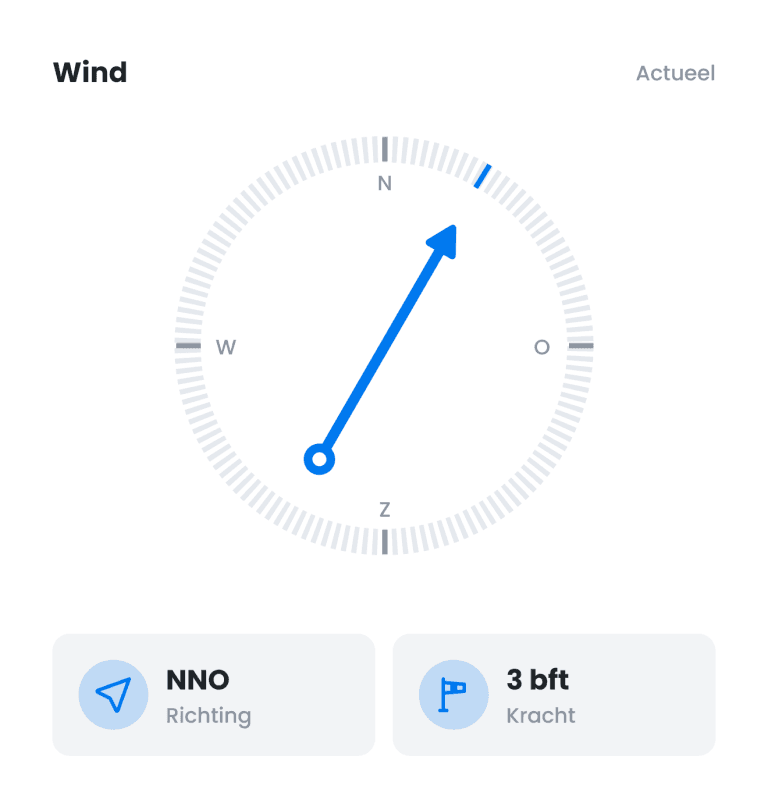
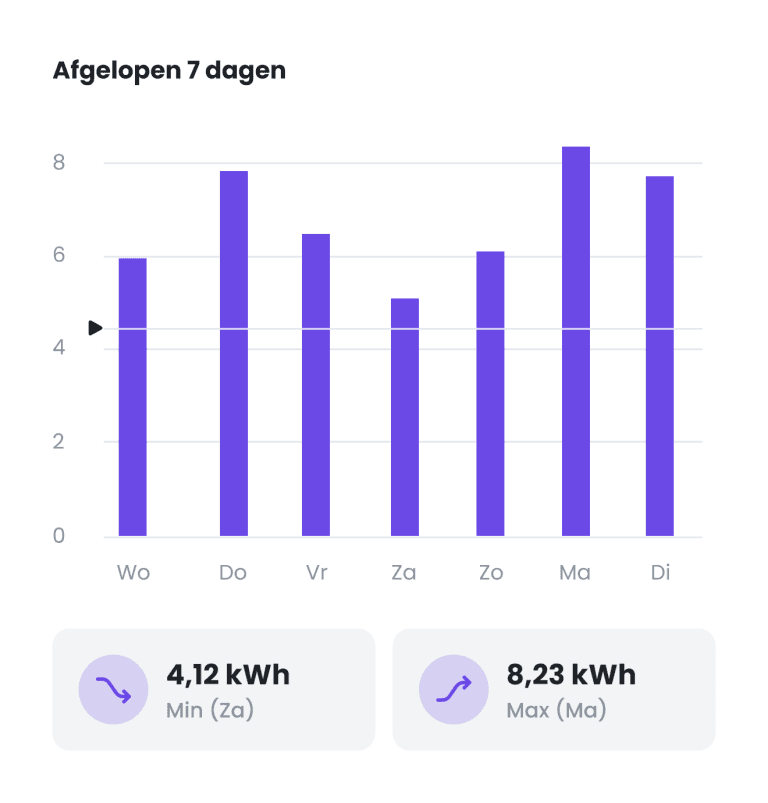
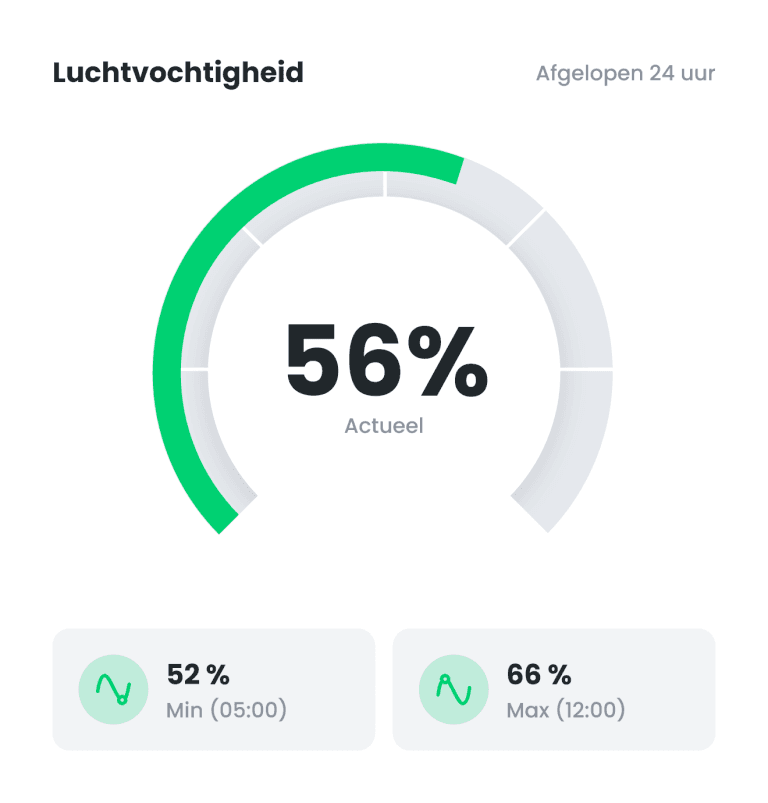
Available widgets
Choose from up to 25 available widget types, such as charts, data overviews, analyses, photos and many more.
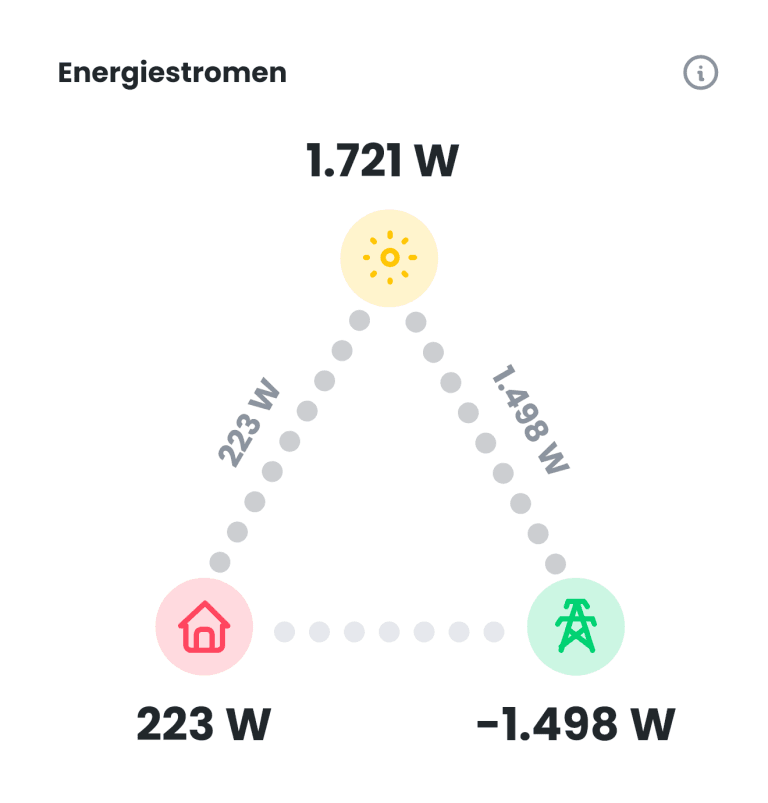
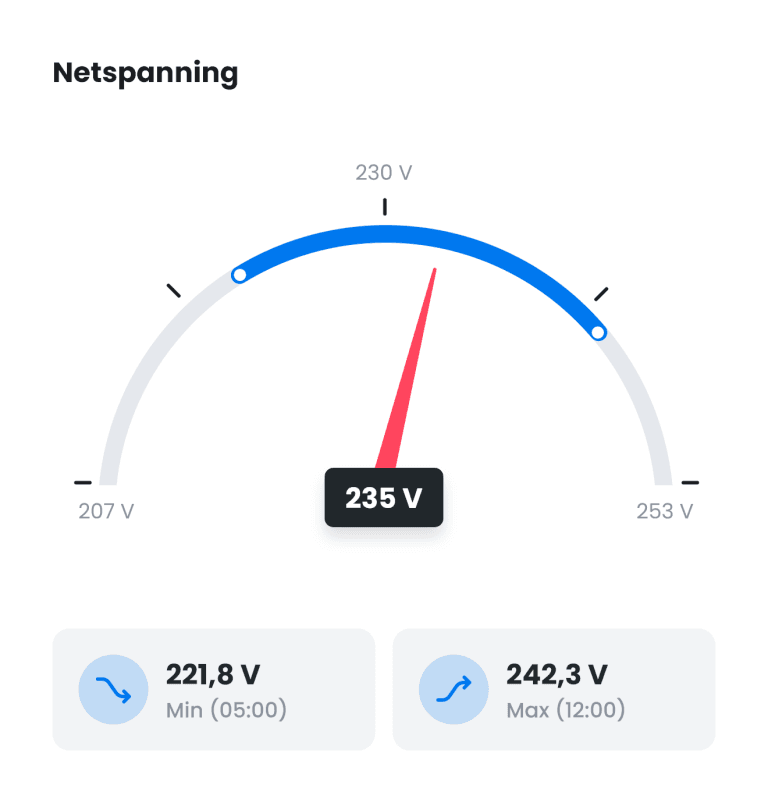
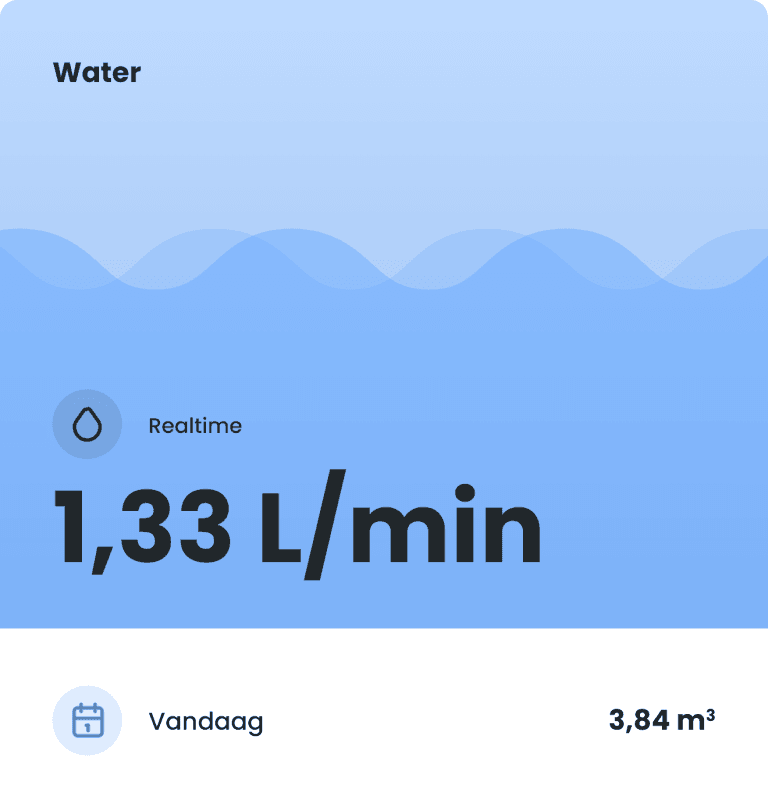
Customize widgets
When adding a widget, choose what data is displayed. For example, the current grid voltage or your current energy consumption.
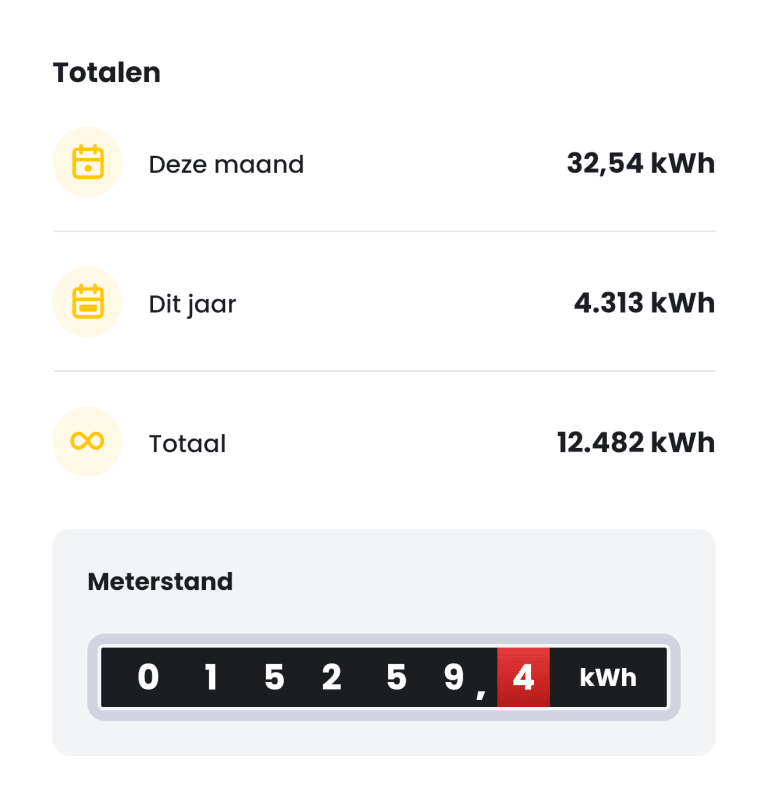
Combinations
The amount of widgets and space available allows for an almost infinite number of combinations.