
View energy data.
View detailed graphs for each connected energy meter. These show consumption or production per minute, day, month, year, or over a period of your choosing. You can also easily switch between different measurement data within the same meter, such as energy (kWh) and voltage (V).
CEMM 3.0 stores all data minute by minute. View your energy data in detail using the graphs.
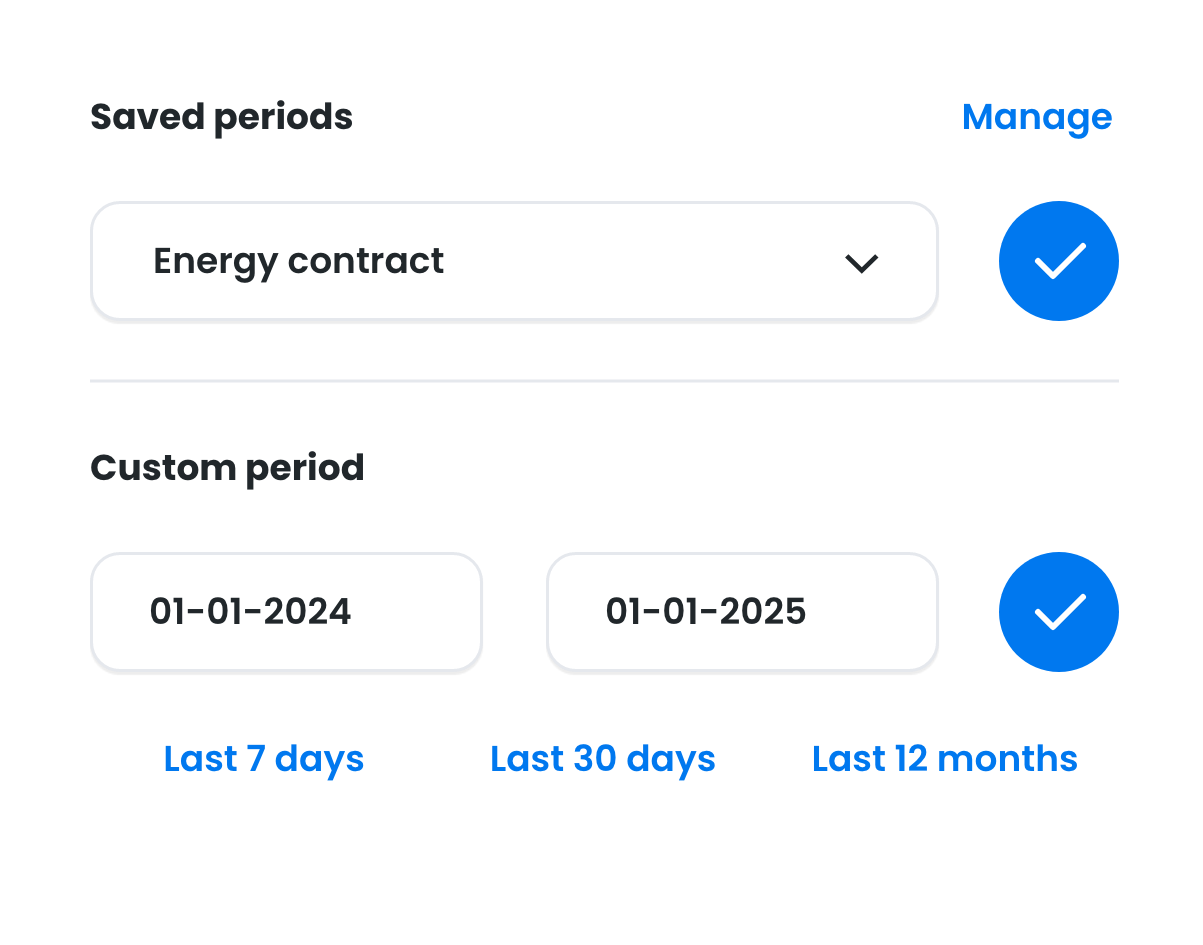
Choose a standard period (day, month, or year) or choose your own. For example, the term of your energy contract.
Also view additional data including voltage (V) and current (A), and create custom graphs.
Detailed graphs
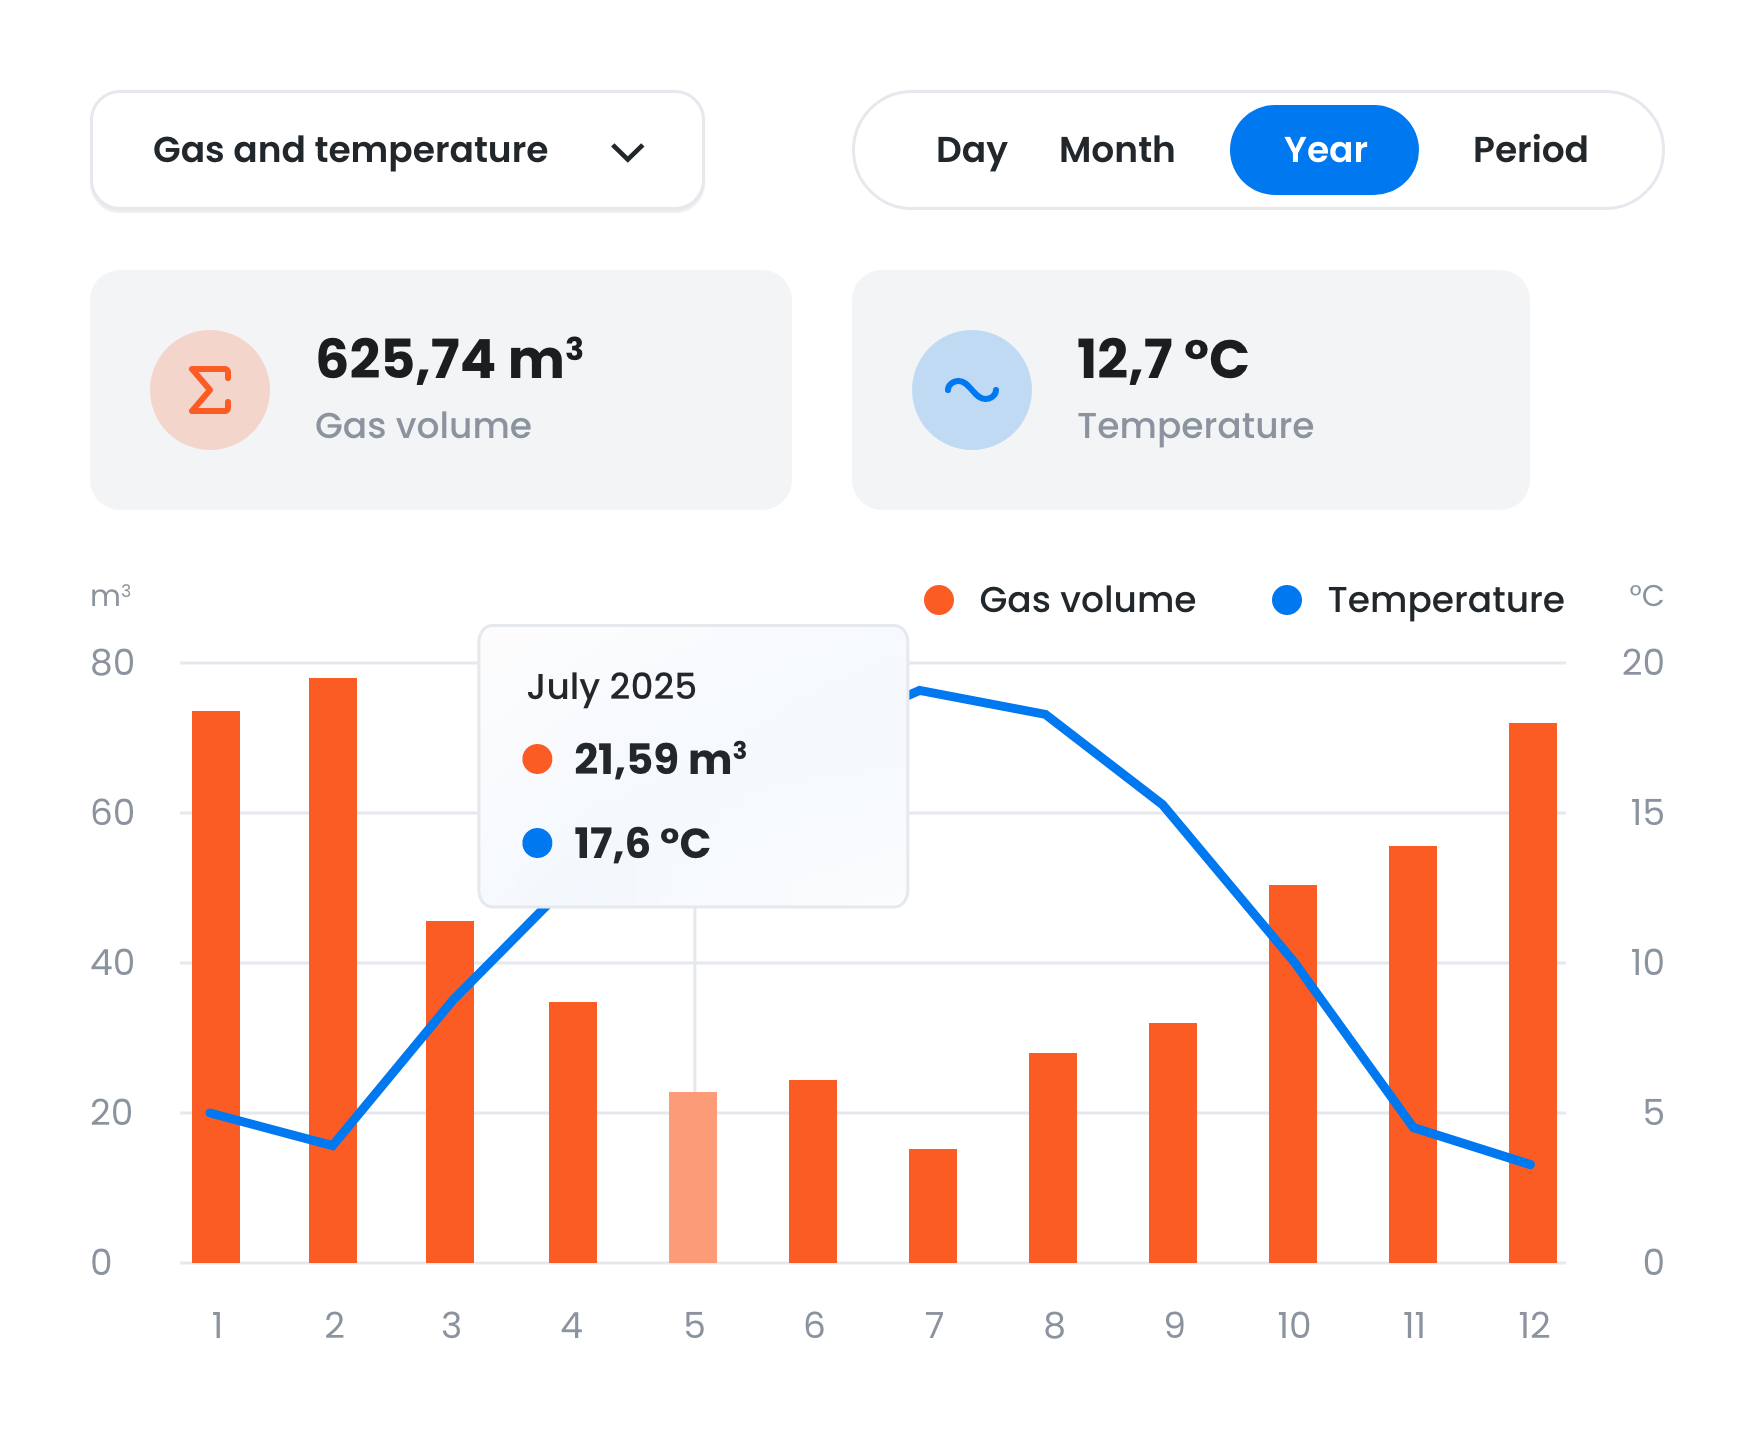
Every energy meter you read with your CEMM includes a graph page. Here you can view all historical data from that meter, accurate to the minute. Additional statistics are displayed alongside the graph, such as total and average consumption over the selected period. Zoom in or out on graphs to see more or less detail.
From minutes to years
CEMM stores all data minute by minute, so you can review your data with great accuracy.
Statistics
The graphs show your total consumption or production (of the visible part of the graph), and averages.
Zoom
Zoom in on graphs for more detail. Zoom in on an hour, for example. You'll also see the total and average consumption within that hour.
Custom periods
View your data for any desired period. For example, your solar energy yield during the summer months or your gas consumption during a cold winter week. You can also save multiple periods, such as the duration of your energy contract. This way, you don't have to set it manually each time.
Additional information
Easily switch between all the "channels" associated with each meter in the graph. These include power (W), volume (m³), energy (kWh), voltage (V), current (A), costs (€), temperature (°C), and more. You can also create your own "time series," combining or offsetting these channels. For example, you can overlay the outdoor temperature on your gas consumption, or combine your consumption and production in a single graph.
All about Time Series