
Changelog CEMM update 1.7.0
Update 1.7.0 for the CEMM has been released. This update contains several major additions and a few bug fixes.
Changelog
Periods
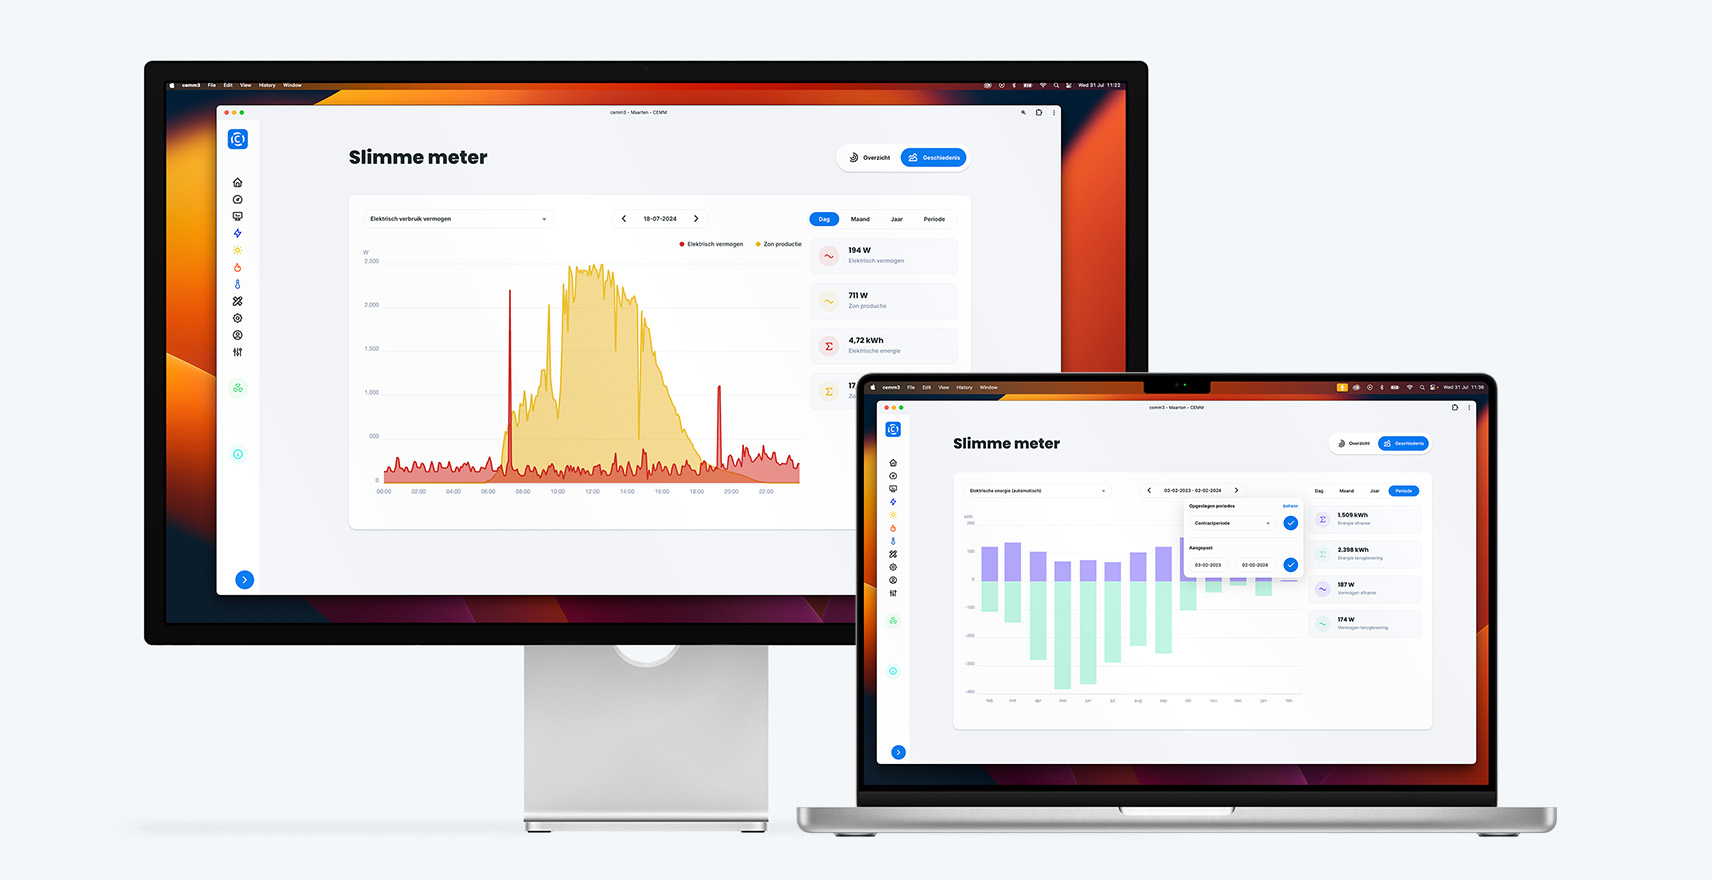
On the graph page, the "Period" option has been added to the list of day, month, and year. A period contains a user-specified start and end date. The display is determined by the length of the period. A period of 7 days or less is displayed as a line graph by default. A period of up to 31 days is displayed as a bar chart of days by default. Anything longer than 31 days is displayed as a bar chart of months by default. These breakpoints can be adjusted via Preferences. To simplify selecting periods, you can create and manage periods on the Settings > Meters > Periods page. There, you can name a period and link it to specific meters. This allows you to add, for example, the contract period of your energy contract.
Meter extensions
The CEMM can sometimes read more data from (smart) meters than the default setting. With smart meters (and Belgian digital meters), this often concerns voltage and current (per phase), and with three-phase connections, it also includes power consumption and feed-in per phase. It is now possible to read this additional data with the CEMM. This can be configured with a single button press. Go to Settings > Meters and select Advanced settings under Smart meter. A block with extensions will then appear. Select the desired extension(s) to apply them.
Peak power / Capacity tariff (Belgium)
Since this update, the CEMM can read these peak capacities from the digital meter. This can be activated as a meter extension; see the explanation above. After activation, a graph showing the historical and current peak capacities is displayed on the meter's overview page. You can also place this widget on your dashboard yourself. In Belgium, energy rates are partly based on peak capacity. This peak capacity is tracked by the digital meter. More information about the capacity tariff and peak capacity: https://www.fluvius.be/capacitytariff
Time series
Each meter has several time series that can be viewed (among other things) via the History page. It's now possible to edit these time series or add more. This advanced feature offers a wide range of possibilities, including:
- Combining data from different meters, consider: Overlaying a voltage graph over solar production Overlaying two power levels from two meters Overlaying two meters Adding two meters together Adding two channels together (as the "group high and low tariff" preference also does)Graph of voltage over solar productionSuperimposing two powers from two metersAdd two meters togetherAdd two channels together (as the “group high and low rate” preference also does)
- Graph of voltage over solar production
- Superimposing two powers from two meters
- Add two meters together
- Add two channels together (as the “group high and low rate” preference also does)
- Create cumulative graph
- Add or remove statistics
- Adjust the y-axis range (for example, present voltage between 207V and 253V for more detail in the graph)
For more information, see the Wiki page.
Other changes and bug fixes
- Added a preference to open the History tab by default after clicking on a meter (only the first time per portal/app visit)
- Static chart widget now refreshes every minute (previously every 5 minutes)
- Tooltip and unit added to weekly chart widget
- Fixed bugs when requesting uploaded media in the Android/iOS app.
- The time series of individual voltages and currents (phases 1 through 3) have now been merged into a single time series with three lines (if all three are available). If the separate time series were used in the "Graph widget," it will need to be updated to the new time series.
- Added option to set the title of the “meter” widget.
Advanced/Technical
- It is now possible to manage the registers via the device options
- TRANSIENT aggregation method added. No data is stored for channels using this method. This method is used to read and publish real-time data from a device. The only subject available is real-time.
- DERIVED aggregation method added. No data is stored for channels using this method. Channels with this method can be used for notifications, exports, time series, and most widgets. A DERIVED channel combines data from other channels using a defined formula. This is a powerful feature that allows you to, among other things, add or subtract multiple meters, or calculate averages.
Learn more about calculated channels.
View an example of adding two (sun) meters.
Changelog update 1.7.1
Shortly after update 1.7.0, update 1.7.1 was released with the following changes:
- Added an option to the Modbus RTU and TCP meter wizards to add a "Custom meter." This allows you to specify which registers are read. Common registers can be automatically detected if the Modbus device uses the SunSpec protocol.
- Period date selection expanded with buttons to quickly select the last 7 days / 30 days / 12 months.
- Fixed a bug where the chart tooltip wouldn't work properly on pages with multiple charts.
- Fixed a bug that sometimes caused an unnecessary interruption in the smart meter reading.
- Fixed bug in pulse counting when frequency was higher than about 11Hz (~40kW).