
Preview live graph widget
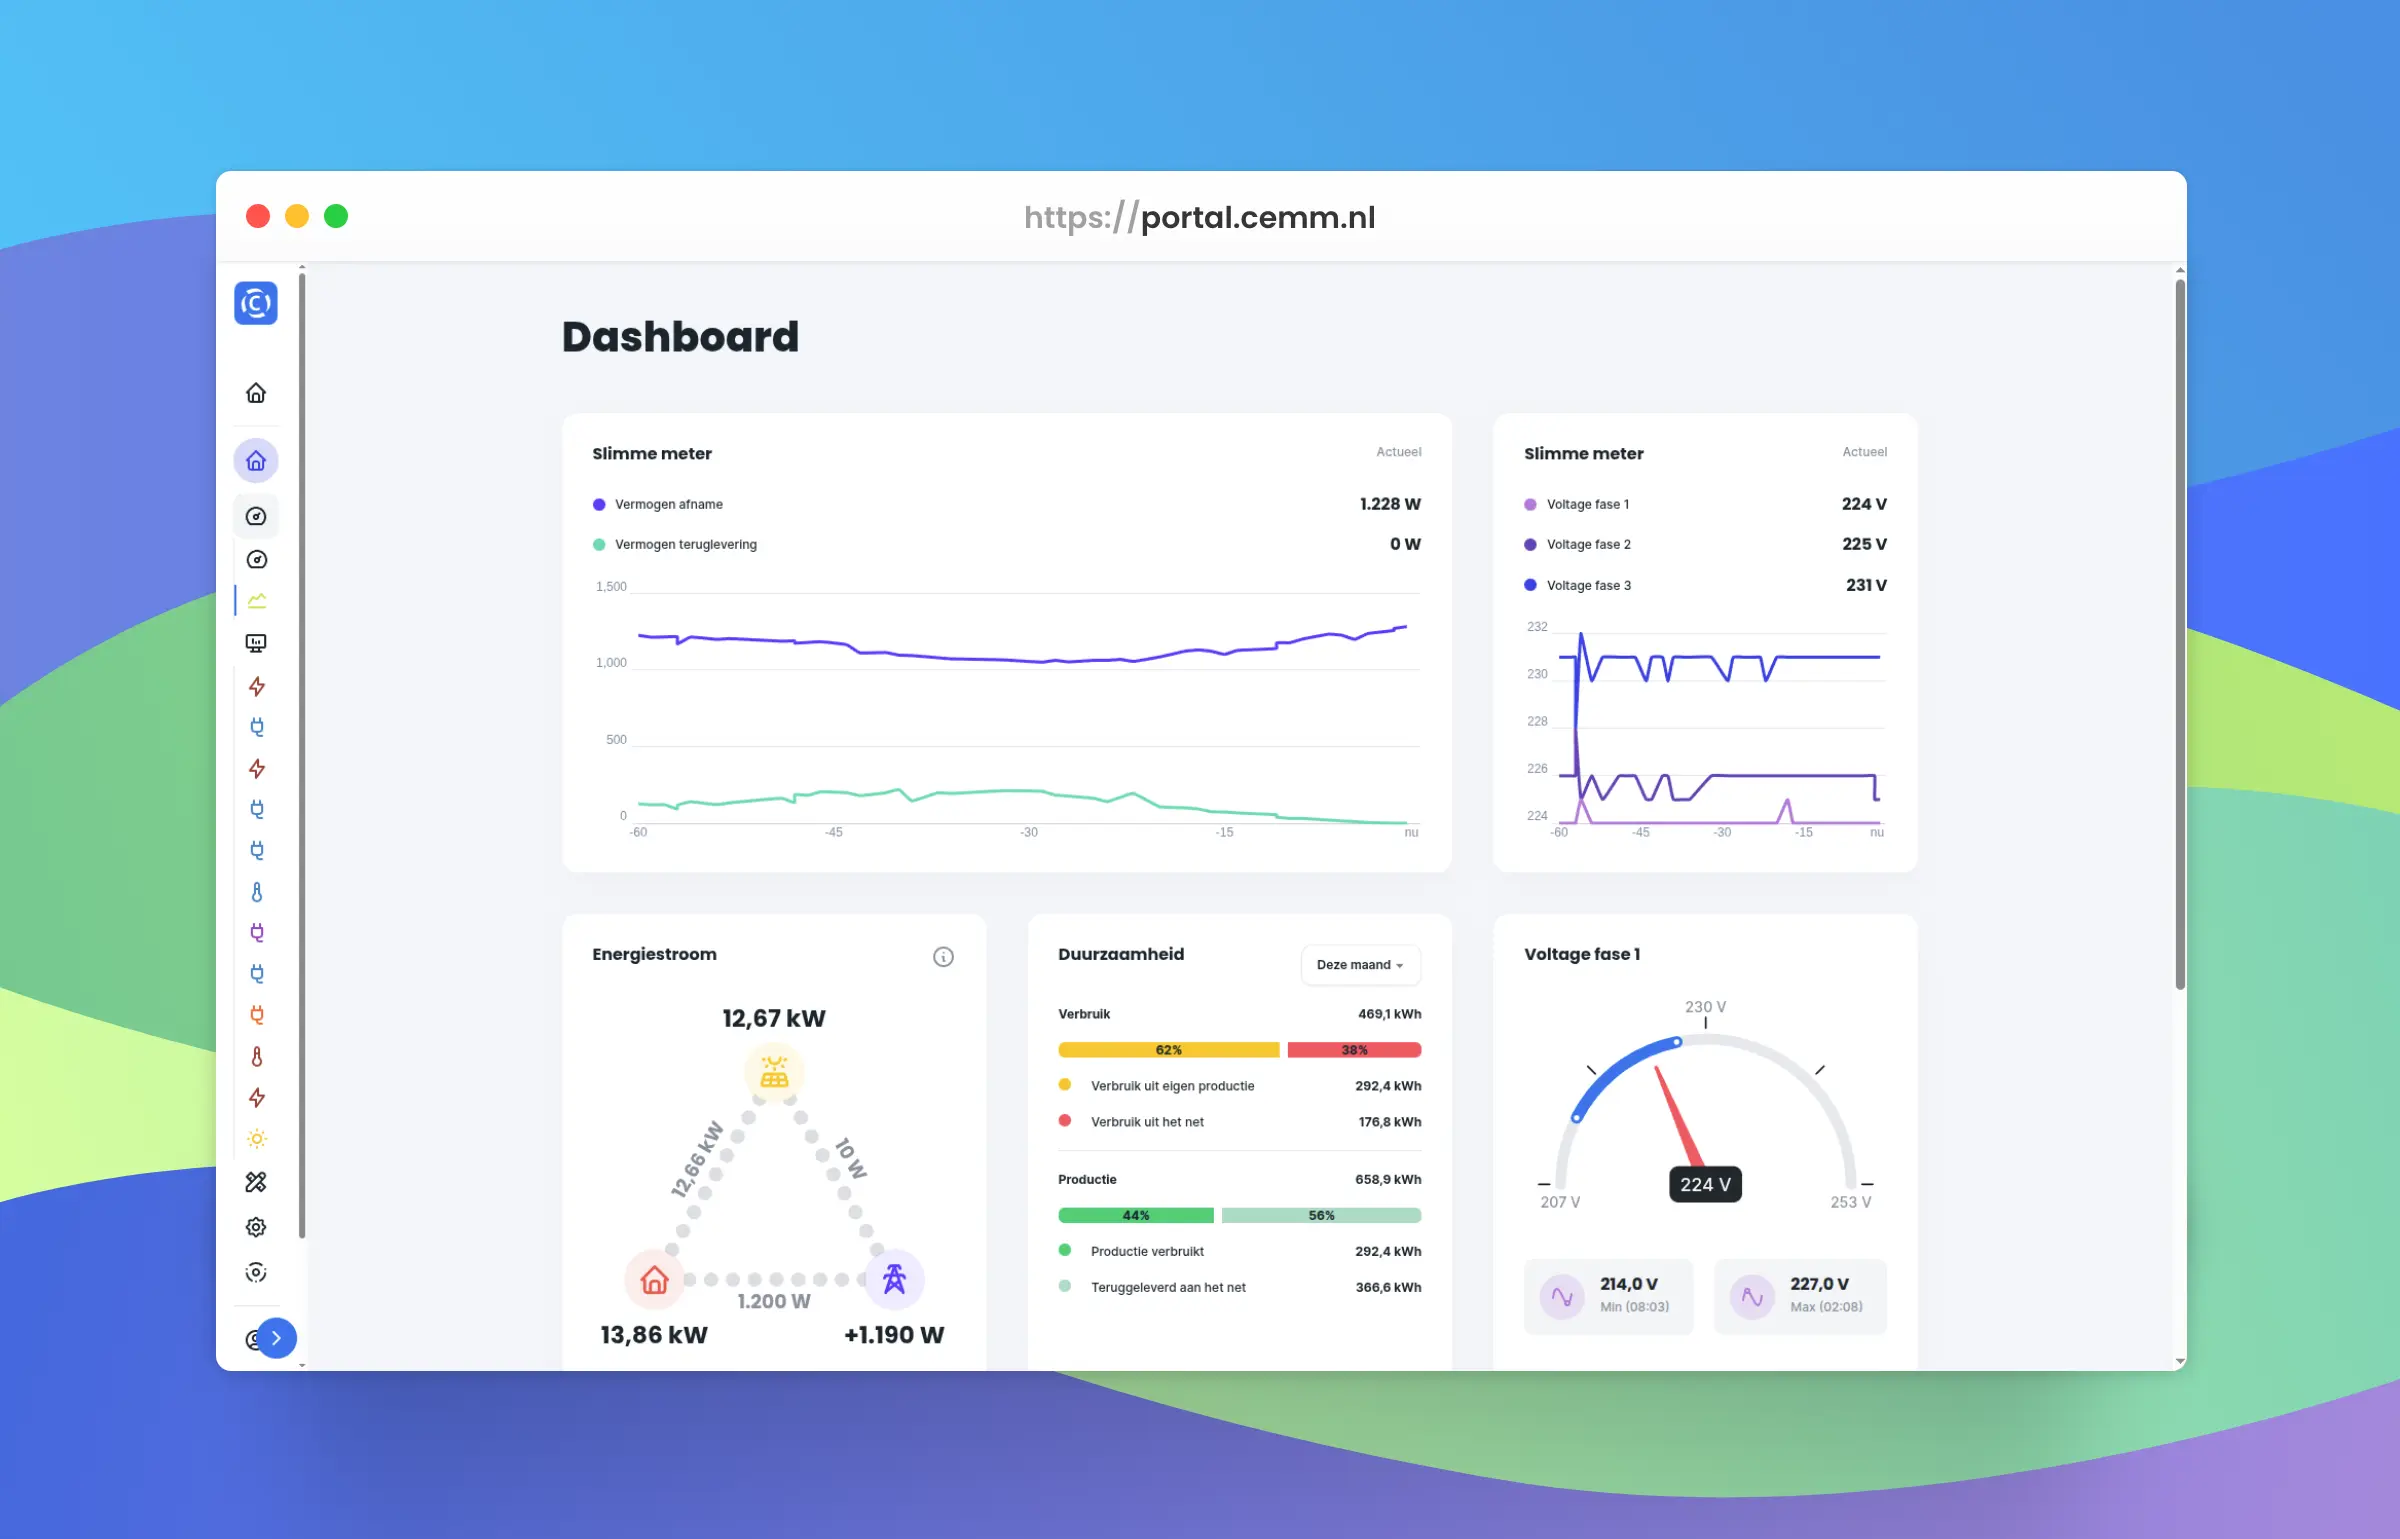
In the upcoming CEMM update, we're introducing a new widget: the live graph widget . This widget displays a graph that automatically updates as new measurement data arrives. Smart meters (DSMR 4, DSMR 5, and e-mucs) provide new data every second, so the graph is continuously updated and rapid fluctuations are visible. Below, you can see an example of our smart meter's output.
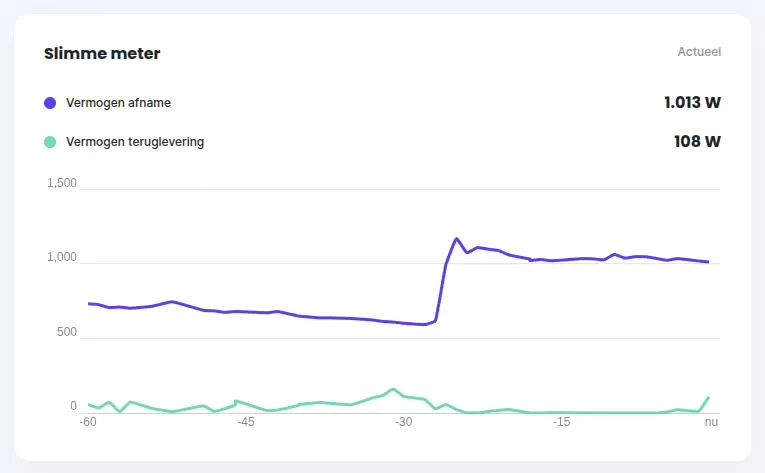
The CEMM stores an (average) value every minute. This provides ample resolution for most applications, but minute averages do mask short peaks or rapid changes. The live graph widget highlights these short peaks and rapid variations, giving you more insight into your system.
When configuring the widget, you can select one or more channels, for example, only three-phase power or voltage, or, as mentioned above, the power from both consumption and return. The widget works with all channels that are averaged, such as power, voltage, and temperature, but not with meter readings, for example. The graph shows the last 60 seconds by default, but this can be expanded to up to 5 minutes.
Once the widget is displayed, the chart is built using values still in memory (up to one minute) and then supplemented with live data.
We're currently finalizing the update and testing it internally. As soon as the new version is available, it will be automatically installed on your CEMM. Keep an eye on this website for new previews, the full changelog, and the release date.