
Preview: Weather data and smart plugs
In December 2024, we will release update 1.10.0 for CEMM 3.0. This new software version contains several major and minor additions and changes. In this preview, we'll cover three topics in more detail: power plugs, weather, and new widgets.
Shelly smart plugs
Shelly is a manufacturer of various home automation and smart home products. These include smart wall plugs, relays, dimmers, and much more. Shelly is very popular, and these products are readily available at competitive prices. Starting with update 1.10.0, the CEMM supports a select number of Shelly wall plugs (Shelly Plug gen1, Shelly Plus Plug S gen2, and Shelly Plug S gen3), making it possible to monitor individual devices with the CEMM as well. This doesn't just apply to energy consumption; for example, if you have a small solar panel system connected via a plug (plug & play), you can also easily monitor production via your CEMM.
Adding a Shelly product is very easy; the CEMM can find it via the local network. Added Shelly meters can, of course, be used in the CEMM in the same way as kWh meters. Since update 1.7.0, you can also add, subtract, or offset meters. You can also easily create exports or set notifications.
Monitor weather data
Weather data can be very relevant for energy monitoring. Consider, for example, the relationship between temperature and your gas consumption. Starting with update 1.10.0, you can connect Openweathermap.org to your CEMM, allowing it to retrieve weather data for your location. This adds an additional "Weather" meter, which logs data such as temperature, cloud cover, wind, and humidity. We're also adding support for degree days.
Just like with Shelly plug-in meters and kWh meters, you can also combine the logged weather data with other meters. This allows you to overlay temperature data on your gas consumption, or, for example, temperature and cloud cover data on your solar energy output.
New widgets
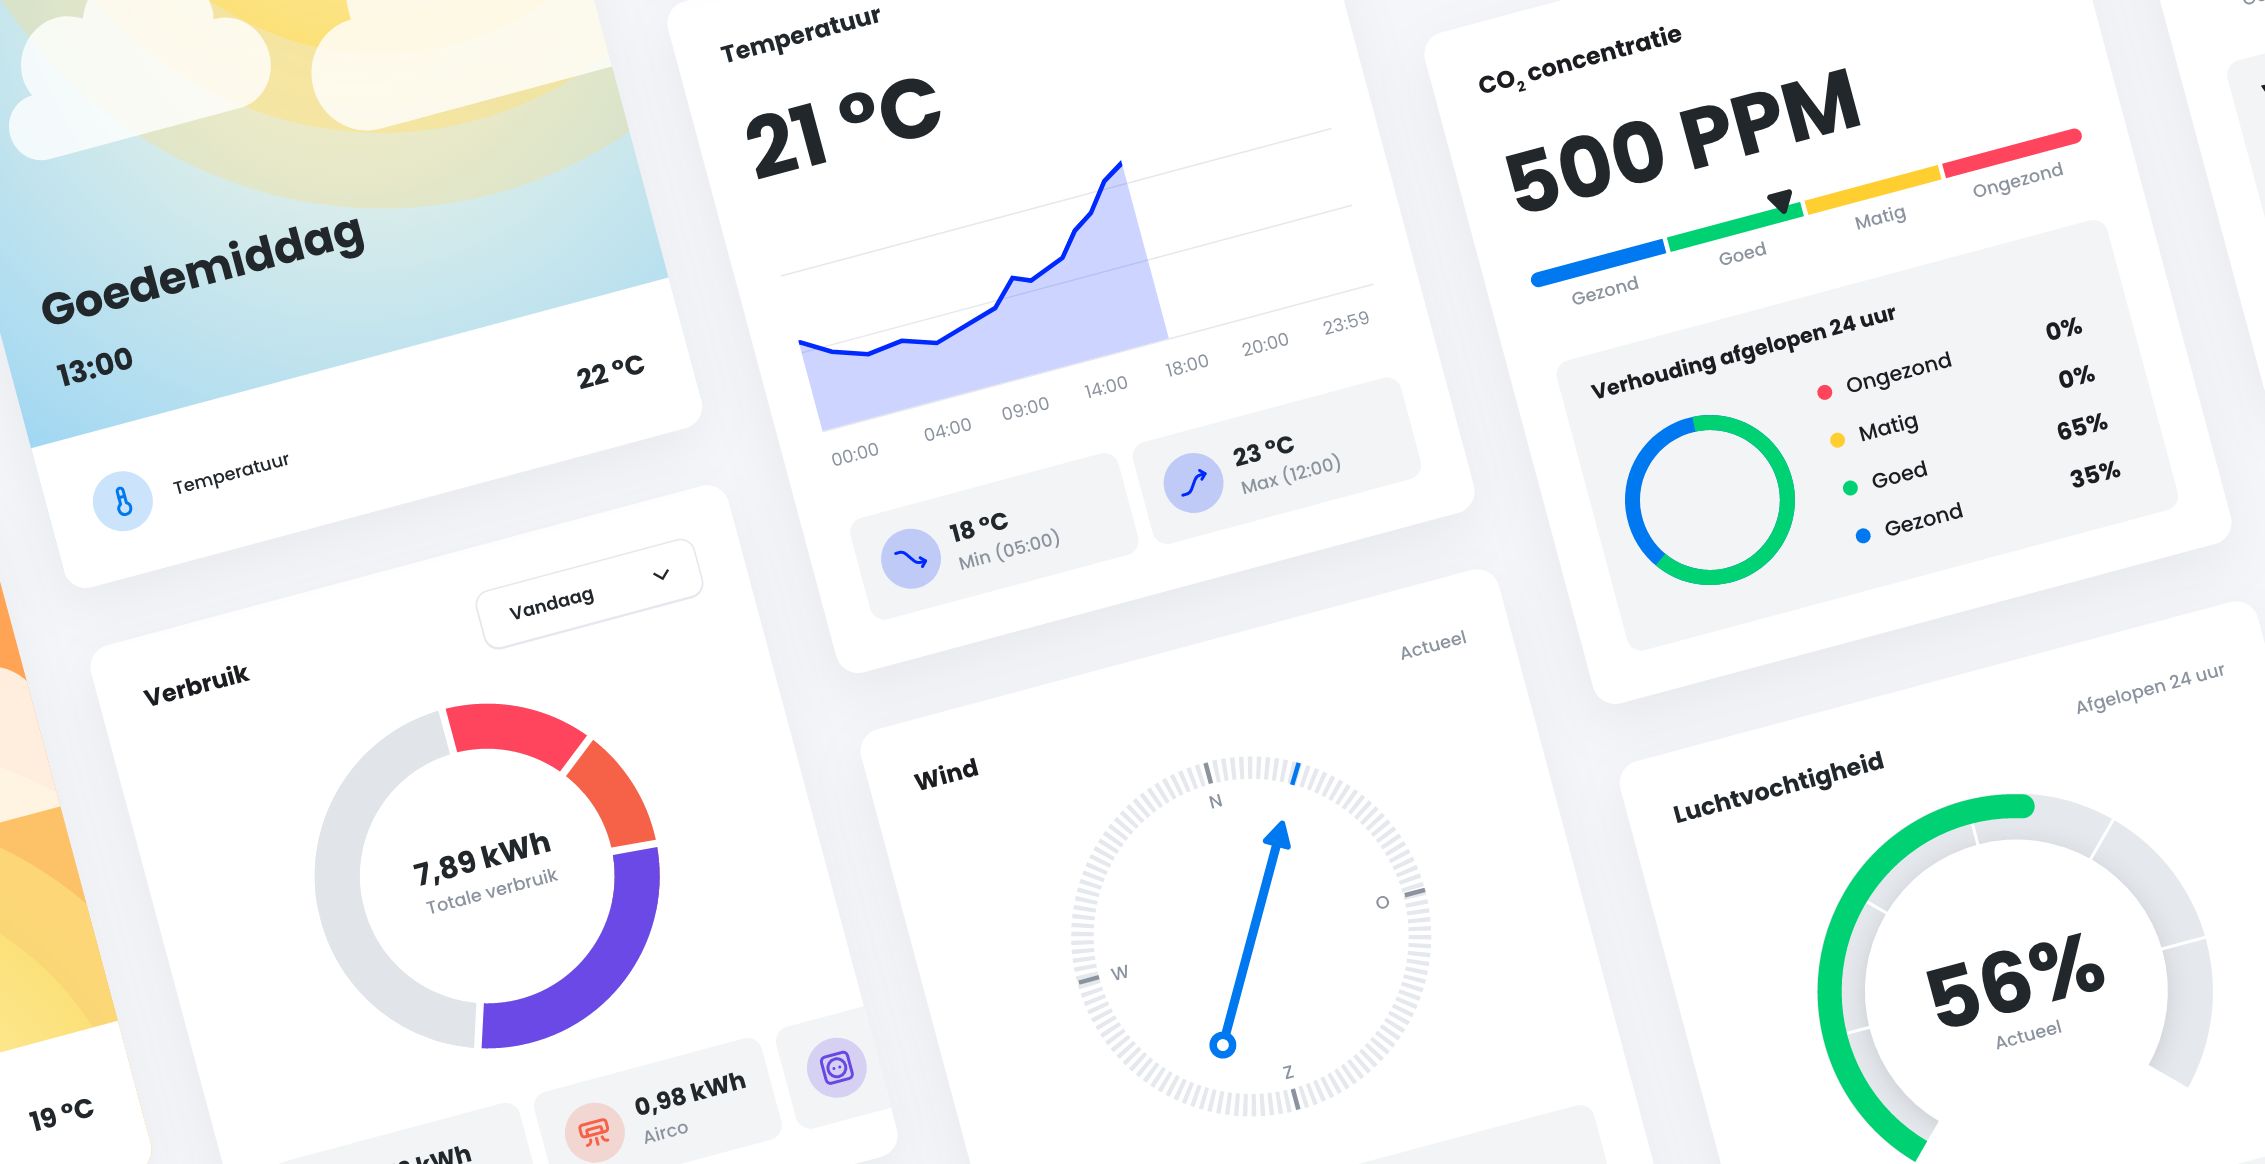
We're adding six new widgets for use on the dashboard, gauge overviews, and in the CEMM display. These widgets are specifically designed for the new features of update 1.10.0, but can also be used with your existing gauges.
- “Current channel”: this shows a current value with a graph of the last 24 hours and the minimum and maximum values in that period below it.
- "CO₂ level": This shows the current CO₂ level on a scale from excellent to poor. The widget also shows the ratio of this scale over the past 24 hours.
- “Wind”: This shows the current wind direction and speed.
- "Digitometer": This displays the current value in a small gauge. It can be used, among other things, to display relative humidity on a scale of 0 to 100%.
- "Value Range Overview": This widget shows how many days the value fell within each range for four adjustable ranges. This can be set to the number of days in the current month or year. One of its applications is to display days with no, low, moderate, or high gas consumption.
- “Energy distribution”: this shows the ratio of consumption/generation of multiple meters.