

Preview: CEMM update 1.16 - dynamic tariffs
In this second preview for CEMM update 1.16, we look at the new features regarding tariffs. It will be possible to view costs at the quarter-hour level, we are adding two new widgets, and CEMM is gaining support for dynamic tariffs.
Dynamic tariffs
It will be possible to calculate costs and revenues based on dynamic tariffs. After activation, the CEMM retrieves day-ahead market prices from the ENTSO-E platform (via our cloud). This market price can be displayed in a widget or graph and can be used to calculate electricity costs/revenues in the Netherlands, Belgium, Luxembourg, or Germany.
Depending on your needs, you set dynamic tariffs in three steps, where each subsequent step is optional:
- Activate dynamic tariffs for your region via Settings > Tariffs > Dynamic tariffs. You can then view raw market prices.
- Set the purchase and sales fees, energy tax, and VAT depending on your energy contract. Afterwards, you will see the all-in consumption and feed-in prices alongside market prices.
- Do you also want to calculate costs? Then go to Settings > Tariffs and click "Update tariffs". Next, change your fixed tariff to the dynamic tariff. Are you switching back to a fixed-price contract later? You can adjust that here as well. The market price and all-in prices will remain available.
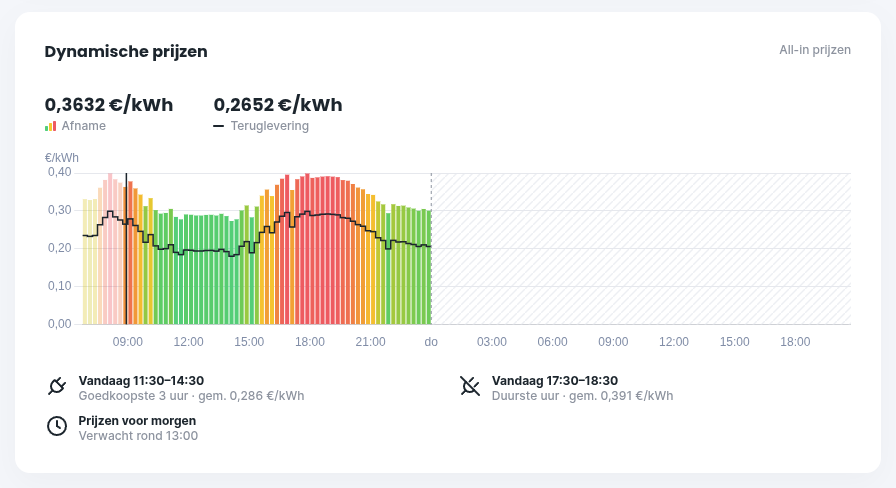
The dynamic pricing widget displays the price every 15 minutes for the rest of today and, as soon as the prices are known (around 13:00), also for tomorrow. You can choose whether market prices or all-in prices are displayed. Below the graph, the most expensive hour and the cheapest period (the number of hours is adjustable) are shown.
Costs per quarter hour
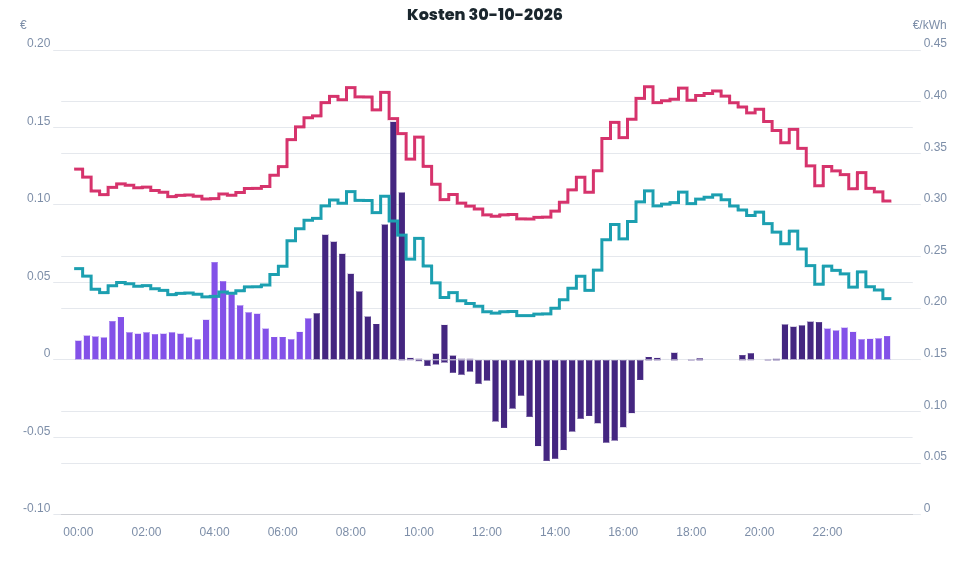
On the chart page, you can now also select the "Costs" time series at the daily level. This works even if you do not have dynamic tariffs enabled.
If you have enabled dynamic tariffs, you will also see two lines for the consumption and feed-in prices (on the right y-axis). This makes it easy to see whether high costs are caused by high prices or by high consumption.
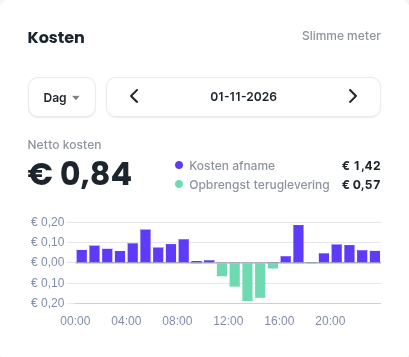
The new cost widget
The "Costs" widget shows the cost of your consumption and the return on your account per day, month, or year, with bar graphs per hour, day, or month. Additionally, you can see the net amount for the entire period. This widget also works if you do not use dynamic tariffs.
Continue in update 1.16
- Check out the previous preview for a number of handy features.
- Improved support for battery monitoring. Keep an eye on this website for a preview.
- Many bug fixes and minor improvements.
We are currently finalizing the update and testing it internally. As soon as the new version is available, it will be automatically installed on your CEMM. Keep an eye on this website for new previews, the full changelog, and the release date of the update.